![Filmhub_Logotype_Neg.png]](https://help.filmhub.com/hs-fs/hubfs/Filmhub_Logotype_Neg.png?height=25&name=Filmhub_Logotype_Neg.png)
Future Today Insights gives you a detailed, visual breakdown of how your titles are performing across the Future Today network, so you can see what's working, where your audience is watching, and how to make smarter decisions about your catalog. Future Today Insights are currently only available for Plus and Pro Plan Subscribers
How to find it:
- Navigate to your Dashboard
- Click Insights in the left-hand menu of your dashboard.
- Select Future Today from the drop-down menu.
Page Contents
- Overview
- Chart
- Panels and Filters
- The Panels in Detail
- Estimates vs. Final Statements
- Frequently Asked Questions
Please note that, like any other earnings or performance reports furnished to you, Future Today reporting data is confidential and sharing your reporting data publicly can result in removal from Future Today and potential legal action.
Overview
Future Today Insights provides detailed analytics on your movie and show's performance across the Future Today network. Use these insights to:
- Monitor audience engagement over time
- Identify your top-performing titles
- See where your content is being watched — by device, including Roku, Amazon, Android, and Comcast
- Compare content types and brands to better understand viewing behavior across the network
Future-Today Insights data is updated regularly as we receive them directly from the channel.
Chart
The chart is an at-a-glance view of audience engagement over time.
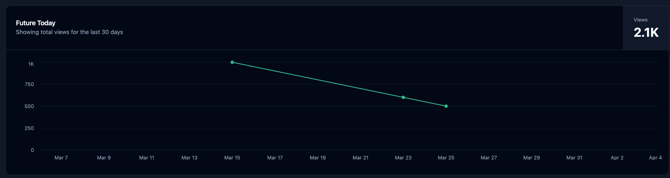
Metrics at the top of the chart show your total views for the selected time period. You can select to view data from the last 30 days.
Available metrics:
- Views: the total number of views your content has received
Selecting a time period:
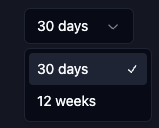
Use the dropdown in the top right to choose a range between 30 days and 12 weeks. The chart will update to show per-day or per-week breakdowns depending on the range you pick. This selection applies to the chart and every panel below it, so you're always looking at a consistent window of data.
Panels
Below the chart, a set of panels break your metrics down into more specific segments, like title, platform, brand, and content type.
- Panels initially show your top performing segments for that category.
- Click the expand arrow in the bottom corner of any panel to see all values and search within them.
- Click the download icon in the bottom left of any panel to export that panel's data as a CSV.
.png?width=670&height=299&name=image%20(33).png)
Filter
Click any entry within a panel to apply it as a filter for the chart and all panels. This is an easy way to filter your data. The filter is added to the top of the chart, listing all current filters. You can deselect any filter at the top of the Chart to remove your filter and reset the view.
The Panels in Detail
Top Titles
Breaks down your selected metric across your catalog, so you can see how individual titles stack up against each other. Click a title to filter the whole page down to just that title's performance.
Top Platforms
Displays metrics broken down by viewing platforms, such as Roku, Amazon, Android, and Comcast. Click a platform to filter by it.
Top Brands
Shows how different brands within the Future Today network are driving viewership for your titles.
Top Video Types
Segments the data by content type, including AVOD, Live TV, and gaming.
Estimates vs. Final Statements
Future Today continuously provides estimated data, subject to adjustments and updates over time. These estimates are not actual earnings. To find your estimated earnings or final payouts, refer to the Performance and Statement Pages. Learn more at Schedule: Channel Performance & Payment Timelines.
Frequently Asked Questions
Why don't my Future Today Insights numbers match my final statement?
Insights data is made up of continuously updated estimated viewership, not actual earnings. Final statements will always be reflected in your Statements tab. Learn more about Statements.
How often is the data updated?
Future Today Insights data is updated regularly as we receive it from the channel. Because it's estimate-based, small fluctuations between updates are normal and don't necessarily indicate an error.
Can I see historical data older than 12 weeks?
The chart supports time periods between 30 days and 12 weeks. For performance data outside that window, you can find it in your Performance page.
Can I export my data?
Yes. Click the download icon in the bottom left of any panel to export that panel's data as a CSV.
Why can't I see all my titles/platforms/brands in a panel?
Panels initially display only your top segments. Click the expand arrow in the bottom corner of any panel to view and search the full list.
How do I remove a filter I applied?
Any active filters appear at the top of the chart. Click a filter there to deselect and remove it.
Is "Views" the only metric available?
Currently, Views is the metric available in Future Today Insights. If additional metrics are added in the future, this article will be updated to reflect them.